Why Favorite Tweets?
I typically favorite tweets for one of two reasons:
1. They are hilarious and I get a good chuckle in the belly every time I look at them:
https://twitter.com/boone/status/289517299109605376
2. They have info or a link I want to save for future reference of some sort:
The last tweet is relevant to this post about analytics (yes, I’m getting there I promise).
As you may already know, sadly @brianfoote left the community team a few months ago, and with his departure we lost a great many things. While I wouldn’t even dream of trying to reboot Footesnotes, I’ve been dipping my toes in the Google Analytics water and started taking over weekly analytics reporting earlier this month. Before then, I would just add my social media stats to Brian’s weekly analytics and call it a day. Well, since it’s been about a semester since I even looked at the social media stats and I didn’t know much of anything about Google Analytics, I was happy when @admin suggested I sign up for an upcoming workshop hosted by JustPublics356 and CUNY J School called: Analytics and Metrics: Advanced Social Media. I thought this would be a wonderful professional development opportunity not only for my position as Community Facilitator on the Commons, but also for my position as Academic Operations Assistant at CUNY SPS. As part of my duties at SPS, I manage web content and LivePerson FAQs. Recently, I started working with the Marketing team on refining keywords and adding micro data to our School’s website. I figured this workshop would be a great way to learn more about Google Analytics, search engine optimization, and social media metrics (a win-win for both SPS and the Commons).
Analytics Workshop: Friday, June 21, 2013
Our Instructor, Sandeep Junnarkar, the Director of Interactive Journalism at the CUNY Graduate School of Journalism, started the workshop by providing a link to his handout: http://bit.ly/analytics4academics. It was great to refer to Sandeep’s handout as he showed the different aspects of Google Analytics and WordPress.
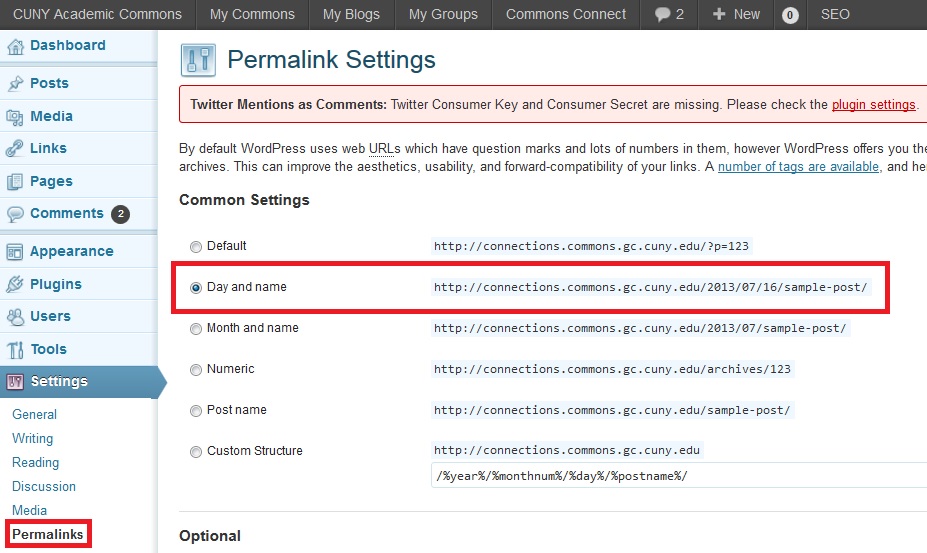
One of my biggest WordPress takeaways was on permalinks — the links for each blog post. As you can see in the screenshot below, the default link is a strange string of characters and numbers that really have no meaning or relevance. Sandeep suggested changing the default to include the day and name, explaining that it’s better not only for search engine optimization purposes, but also for readers who want to know when a post was published. Lightbulb. So many times when I was attempting to research a new technology or troubleshoot an issue, I’d get miffed when I couldn’t find the published date because I didn’t know if the post was still relevant. I have since switched my permalink settings to include the date and subject in case viewers can’t find the published date within the post itself (you might want to check your blog’s permalink settings as well).
While the workshop had a heavy focus on WordPress, I would be able to apply much of what I had learned to the SPS Website project. Another terrific SEO resource on the Commons comes from Robin Camille. In her post, Gentle SEO Reminders, Camille lists some helpful search engine optimization tips for businesses and organizations. She also suggests using the Yoast WordPress SEO Plugin on the Commons, which automatically adds OpenGraph meta tags to blog content based on the keywords and descriptions entered.
Another great aspect of the workshop was the other people who were there. Some had been blogging for years, while others either just started a blog or were thinking about starting a blog. We may not have stayed exactly on track, but the discourse between workshop participants and the instructor made it much more relevant and rewarding.
Twitter Analytics
When Sandeep started talking about how to measure Twitter traffic in Google Analytics my ears perked up — after trying many tools and going through Twitter streams to parse out data I was super excited to learn how to really do it. Since many folks use different Twitter Clients (such as Hootsuite or Tweetdeck), their clicks show up differently in Google Analytics. Obviously Google Analytics has some drawbacks, but Sandeep suggested using Advanced Segments to capture all of the different Twitter Clients; providing more accurate metrics.

By including twitter.com, t.co, tweetdeck, hootsuite, and bit.ly, you will be able to get a more accurate picture of how Twitter is (or isn’t) driving traffic to your site. Since we use the cuny.is URL shortener I have to include that in my advanced segment.
Towards the end of the workshop when Sandeep was discussing various tools that can be used to measure Twitter metrics I remembered that tweet from TechCrunch that I favorited only a couple of weeks before (see, I told you the tweet would be relevant :-) ). Turns out that many of the third-party applications that once measured Twitter metrics no longer worked because Twitter changed their API. I informed the group of Twitter’s recent announcement of their new analytics and Sandeep said that he was interested in checking it out. While we’re on the subject of Twitter’s API messing up stuff, it also recently interfered with an awesome new feature set for the Commons 1.5 release (more on that in an upcoming social media roundup)…
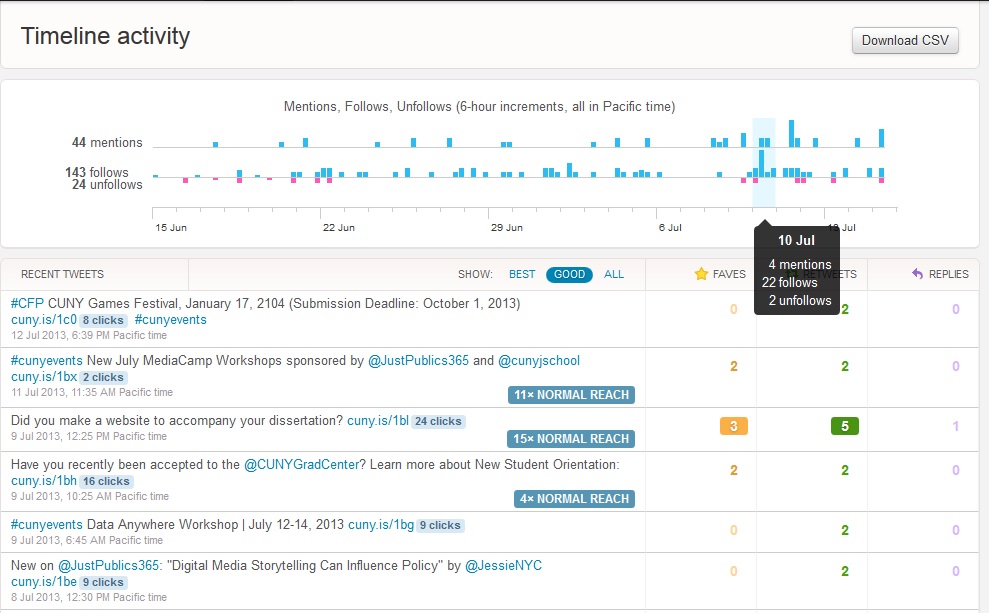
Above is the new Twitter Analytics dashboard, which is great because it’s built directly in Twitter. From what I’ve read around the web (mostly in the comments section), it seems that Twitter hasn’t rolled this out to all of their users and some features vary depending on the user. Since the @cunycommons account was on the right list (no, I didn’t have to pay off Jack Dorsey), I started using it last week to measure RT’s, mentions, favorites, replies, followers, and clicks. You have the ability to download the data in a CSV file, but unfortunately it currently only provides metrics for favorites, retweets, and replies so you still have to scroll through the stream to view all of the metrics. While I can access the Timeline Activity dashboard (screenshot above), I still don’t seem to have access to the Followers dashboard. I expect that more users will be able to use Twitter Analytics in the coming months and that they will refine and expand their metrics as time goes on, but I wasn’t overly impressed with what it had to offer.
@cunycommons Analytics
It was a strong week for us on the @cunycommons Twitter account. Our followers list increased by 2% to 1847. This week’s retweet rate was 28% and, out of the original 36 tweets, the 10 retweets resulted in 9 additional retweets. We also received 24 mentions, 11 favorites, 3 replies, and 152 clicks via Twitter.
Since we attach cuny.is links to all Twitter, Facebook, and Google+ posts, the click through metrics cover all of these platforms in addition to clicks from others’ retweets. This week, according to the cuny.is dashboard, URLs were selected an average of 60 times per link and 1,631 times in total. Our top tweet (below), received 24 clicks in our Twitter stream and 156 altogether via http://cuny.is/1bl.
Many thanks to CUNY Graduate School of Journalism and JustPublics@365 for hosting the analytics workshop! If you are interested in signing up for an upcoming workshop, check out JustPublics@365’s upcoming events.


 dates and sharing resources across multiple social networking sites. And, being the total nerdbot that I am, I happily agreed to maintain our social media presence on both

